
With Amazon FBA, revenue figures often take center stage. Social media is full of screenshots boasting impressive numbers—like $230,000 in sales—that seem to validate the success of certain programs and mentors. But these posts rarely show the other side of the story: profit. Revenue is not profit, and it’s certainly not the money you put in your pocket.
Without considering the full range of costs—including Amazon fees, advertising, product costs, branding, tax, and even program fees—the real take-home amount can be very different. Here’s a detailed breakdown to illustrate why focusing solely on revenue can be misleading.
Revenue vs. Profit: The Key Difference
Revenue is the total income generated from sales, and it often serves as the headline-grabbing figure in social media posts. Profit, however, is what’s left after all expenses are deducted. For a business to thrive, profit matters far more than revenue.
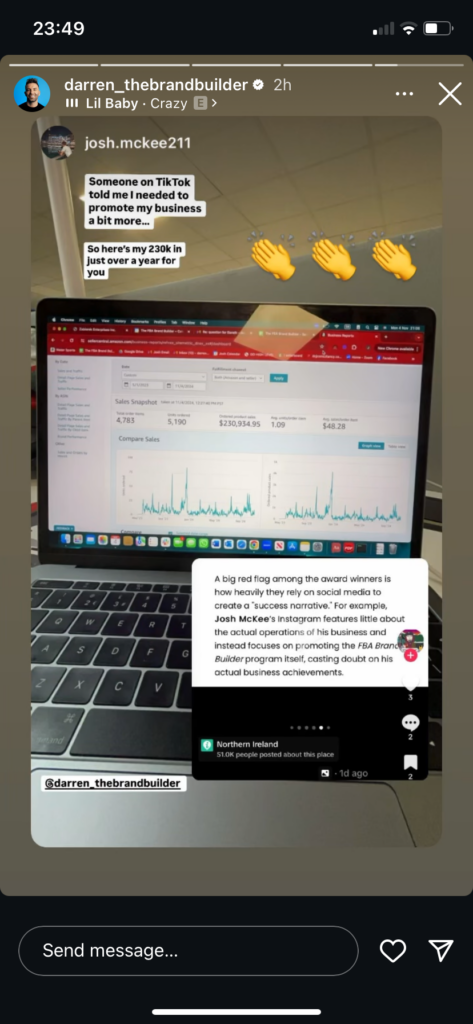
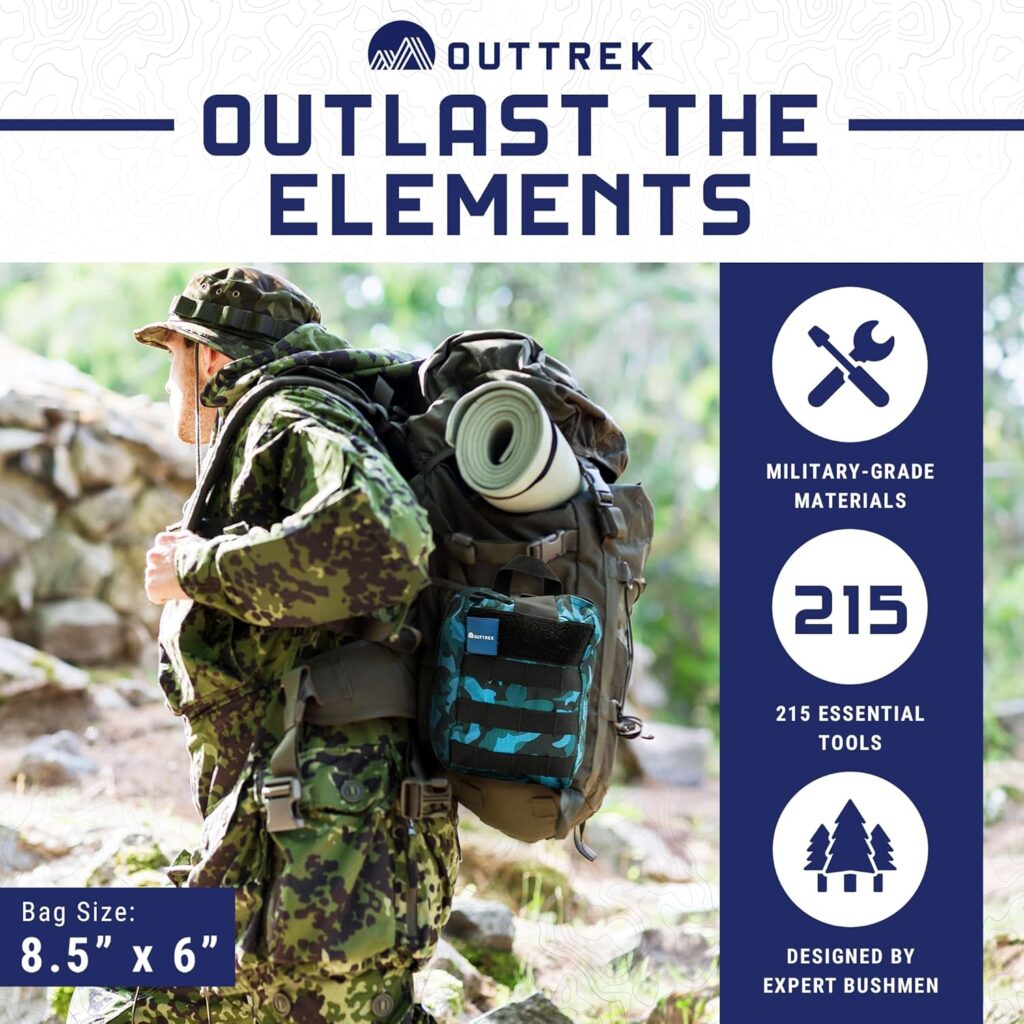
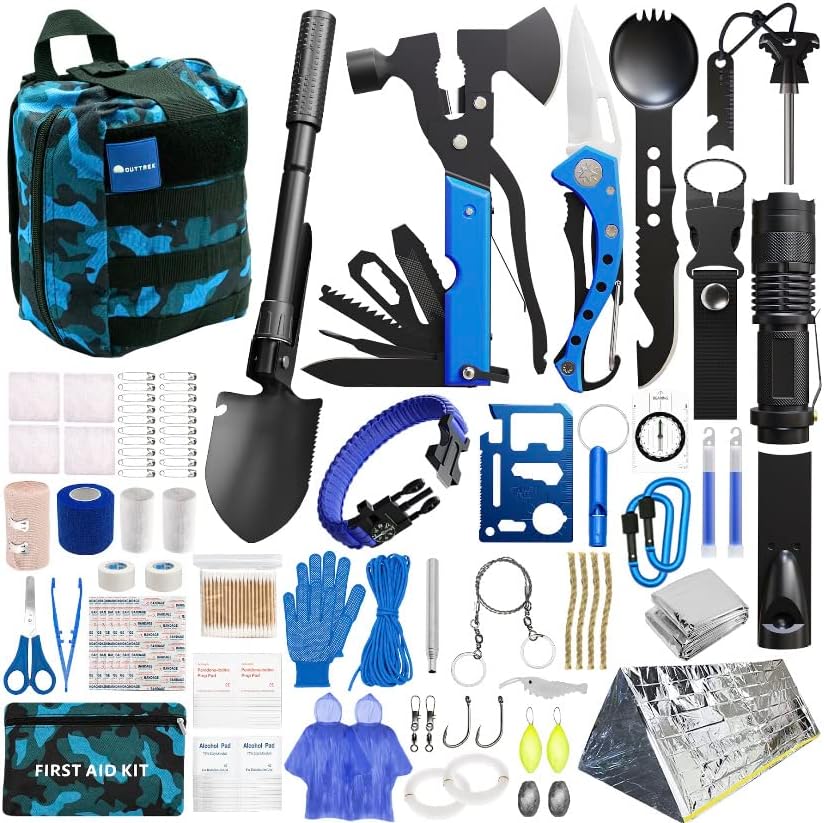
Take, for example, a “Blue Survival Kit” product featured in a recent social media post by Josh McKee, reshared by Darren. This post shows $230,000 in revenue, which looks impressive at first glance. But without breaking down the costs, it’s impossible to tell whether this venture was genuinely profitable or simply brought in high revenue with equally high expenses. For anyone considering an FBA program, it’s essential to look beyond revenue to understand actual profitability.
Returns Aren’t Accounted For: A Key Point in Amazon’s Metrics
Amazon’s "Ordered Product Sales" figure, prominently featured on their Sales Snapshot dashboard, can be particularly misleading. This figure does not factor in returns or refunds. It’s purely a measure of revenue from products ordered, which means that returned items (and the resulting revenue loss) are not reflected here. For example, if 10% of items were returned, the Sales Snapshot would still show the original revenue, inflating the perceived earnings.
To see the real impact of returns on revenue, sellers need to review additional reports, such as the Returns and Payments reports. These reports show the final revenue after all deductions and give a more accurate picture of net sales.
Breaking Down the Costs: A Realistic Profit Analysis
Let’s take a detailed look at the expenses involved to assess the real profitability of this Amazon FBA business.
1. Product Costs (Wholesale)
- For the Blue Survival Kit, we estimated a wholesale cost of $10.65 per unit, resulting in a total cost of $50,938.95 for 4,783 units sold. It’s worth noting that this estimate doesn’t even include delivery costs from the supplier, so the actual per-unit cost may be higher. This generous estimation from a supplier we spoke with, who provides the same product Josh sells, indicates that Josh’s profit margins may actually be much lower than what’s reflected here.
And as a point of caution for potential consumers: Josh’s Outtrek product, like most products sold by students of the FBA Brand Builder course, was sourced through Alibaba. If you’re searching for “Outtrek,” be aware you’re purchasing a fairly low-cost product sourced from China with a significant markup.
2. Amazon FBA Fees
- Amazon charges fulfillment and referral fees per sale, covering picking, packing, and shipping. Given the product’s weight and size, we estimated these fees at $10.99 to $12.49 per unit, totaling $52,565.17 to $59,739.67.
- Storage Fees: We’ve assumed an average monthly inventory of 259 units stored at Amazon, based on typical monthly sales. This puts total storage fees around $1,949.96 for the 553-day period. This estimation allows for stock replenishment but avoids the high costs of storing all units at once.
3. Advertising Costs
- Advertising is a major expense in Amazon FBA. Darren has suggested a daily ad spend of $50 to $70 in one of his videos, so we’ve used the lower end ($50) in our calculations, totaling $27,650 over 553 days. If the actual spend were closer to $70 per day, this would increase, tightening profit margins further.
4. Branding Costs
- Additional costs likely went into branding the product, as each kit features Outtrek's logo on the backpack and packaging. These branding expenses would further impact profit, but as with much of the FBA Brand Builder program, there’s limited transparency regarding these costs.
5. Current Discounted Price on Amazon
- It’s important to note that the product in question is currently being sold at a discount on Amazon. For the sake of simplicity, we used the original RRP ($45.95) for our calculations, but if the product were sold at its discounted price, Josh’s profit margins would be even smaller. This highlights yet another way revenue-focused posts can be misleading, as they may not reflect the realities of fluctuating sale prices.
6. Program Fees
- It’s also worth noting that this analysis doesn’t account for the additional cost of joining Darren’s FBA Brand Builder program itself. These program fees would be another expense impacting profit that is not typically highlighted in revenue-focused posts.
7. Tax Obligations
- For UK residents, business income—including from an Amazon US business—is subject to UK corporation tax. Assuming a tax rate of 19% on net profits, this could further reduce the take-home amount. If Josh hasn’t accounted for tax, he would still be liable for this payment to HMRC. Failure to report income while residing in Northern Ireland is considered tax evasion, which carries legal implications and can be reported to the authorities.
Factoring in this 19% tax on the final profit gives a more accurate view of what could be paid out to him as personal income.
Total Costs Overview
- Wholesale cost: $50,938.95
- Amazon fees: $52,565.17 to $59,739.67
- Storage fees: $1,949.96
- Advertising: $27,650
- Total Cost Range: $133,104.08 to $140,278.58
Calculating the Final Profit
Using the original product price of $45.95, the total revenue from 4,783 sales is $219,778.85. Based on the adjusted costs:
- Pre-Tax Profit: Ranges from approximately $79,500.27 to $86,674.77 over 553 days.
- Post-Tax Profit (after 19% corporation tax): Ranges from approximately $64,395.22 to $70,204.16.
Annualized Take-Home Profit Equivalent
To make this profit more relatable, we can calculate an annual equivalent as if it were a yearly salary:
- Daily profit after tax: Taking an average post-tax profit of around $67,299.69 over 553 days, the daily profit is approximately $121.71.
- Annual equivalent: At this rate, the annualized post-tax profit equivalent is $74,441.75.
- Converted to GBP: Using an exchange rate of 1 USD = 0.78 GBP, this translates to £58,064.57 per year.
Why These Businesses Often Lack Resale Value
Darren often claims that by building an FBA business, students are creating a "brand that could one day be sold." However, Amazon FBA businesses based on white-labeled products generally lack the unique value that attracts buyers. Here’s why:
- No Proprietary Assets: These businesses don’t have patents, exclusive formulas, or intellectual property. They’re simply rebranding generic products, which are easy to replicate. Without proprietary assets, there’s limited value for a potential buyer.
- Weak Brand Equity: Since these brands are tied to Amazon and rely heavily on its marketplace, they rarely build strong brand loyalty or customer relationships. A buyer looking for long-term brand equity might see little value in such a business.
- Lack of Differentiation: White-labeled products are widely available from multiple suppliers. A business that relies on generic products can quickly face competition, as new sellers can enter the market with similar or identical products. This makes the business less defensible.
- Dependence on Amazon: FBA businesses often lack control over their sales channels, relying almost exclusively on Amazon for traffic. This limits growth potential and exposes them to Amazon’s policy changes, which can impact stability—a red flag for potential buyers.
While such a business might generate cash flow, calling it a “brand that could be sold” is misleading. Serious buyers are usually looking for unique value propositions, exclusive products, and growth potential—all of which are limited in generic, white-labeled FBA businesses.
Important Disclaimer: The Reality Behind the Numbers
While these figures give a reasonable estimate, we can’t fully verify each cost breakdown since we’re relying on information from wholesalers and public Amazon fee data, along with assumptions about average monthly units stored. We also didn’t have access to direct information on the exact cost of branding, returns, or additional program fees.
Additionally, the wholesale price we used does not include delivery fees, and the product is currently sold at a discount, meaning Josh’s actual margins could be even lower. Still, this analysis should offer a good ballpark figure that prospective Amazon FBA sellers can use to gauge what’s realistic.
Misleading Representations of Revenue
Recently, Darren reshared a post by Josh McKee showcasing $230,000 in Amazon revenue. It’s clear that Darren encouraged Josh to share this snapshot, yet once again, the post only focuses on revenue without addressing the vital question of transparency. Proudly displaying sales figures from an Amazon dashboard without a detailed cost breakdown and pretending that revenue equals money in your pocket is misleading and, frankly, embarrassing.
Any legitimate business would recognize the importance of showing a complete financial picture, not just revenue alone. It’s good to know that Darren and his “students” are reading and sharing our content, though—what a fantastic endorsement from Northern Ireland’s leading “brand builder”! We must be doing something right.
This kind of selective presentation does nothing to answer questions around true profitability or actual take-home income, leaving potential FBA sellers with unrealistic expectations. And it’s starting to make sense why Darren tends to attract individuals from lower-income backgrounds. They may lack the financial literacy to see that what he’s offering isn’t as beneficial as it appears. Experienced marketers and e-commerce experts can spot misleading claims a mile away, and they’d never fall for a program like this.
It’s worth remembering that painting a narrative of exceptional growth and huge revenue serves one main purpose: to hook your attention and drive signups for Darren’s program. In reality, all the information you need to build an FBA business is freely available on platforms like YouTube or within much cheaper courses. Question everything, and don’t be led by emotional narratives.

TL;DR: Always Look Beyond Revenue
Revenue doesn’t tell the whole story. Profitability, not revenue, determines the long-term success of a business. Social media posts that highlight revenue without mentioning costs, returns, or transparency around key expenses can be misleading.
For anyone considering an FBA venture, it’s vital to look beyond the headline numbers and dig into the financial details that truly matter. So, no, Darren—these revenue figures alone don’t prove anything. This level of detail should be shared transparently, yet the focus remains on sales and revenue alone.
For those interested in learning more about the difference between revenue and profit, here’s a helpful introduction to the basics of revenue vs. profit. Understanding this fundamental concept is key to making informed decisions and avoiding the pitfalls of revenue-focused social media posts.